|
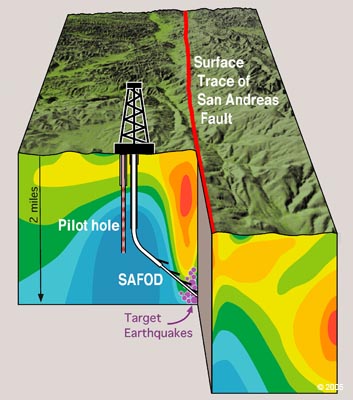
Schematic cross section of the San Andreas Fault Zone at Parkfield, showing the drill hole for the San Andreas Fault Observatory at Depth (SAFOD) and the pilot hole drilled in 2002. Red dots in drill holes show sites of monitoring instruments. White dots represent area of persistent minor seismicity at depths of 2.5 to more than 10 km. The colors in the subsurface show electrical resistivity of the rocks as determined from surface surveys; the lowest-resistivity rocks (red) above the area of minor earthquakes may represent a fluid-rich zone.
The SAFOD is a deep 2-mile borehole observatory that has reached, for the first time, the fault’s active zone early August 2005. The SAFOD will directly measure the physical conditions under which plate boundary earthquakes occur. It is a major step in learning more about earthquakes and maybe predicting them.
Courtesy of EarthScope.
|